+300 Free PPT Charts & Diagrams
for Clear, Impactful Presentations
Download high-quality PowerPoint charts and diagram templates
— including flowcharts, Gantt charts, timelines, and infographics — for business, education, and marketing.
History Timeline Diagram
Visualize your journey with this clean and dynamic history timeline diagram – free and fully editable in PowerPoint and Google Slides. Ideal for company history, project milestones, or key events.
Step-by-Step Flow Diagram
Present your process clearly with this free 4-step flow diagram template. Each stage includes bullet points and direct outcome mapping – editable in PowerPoint and Google Slides.
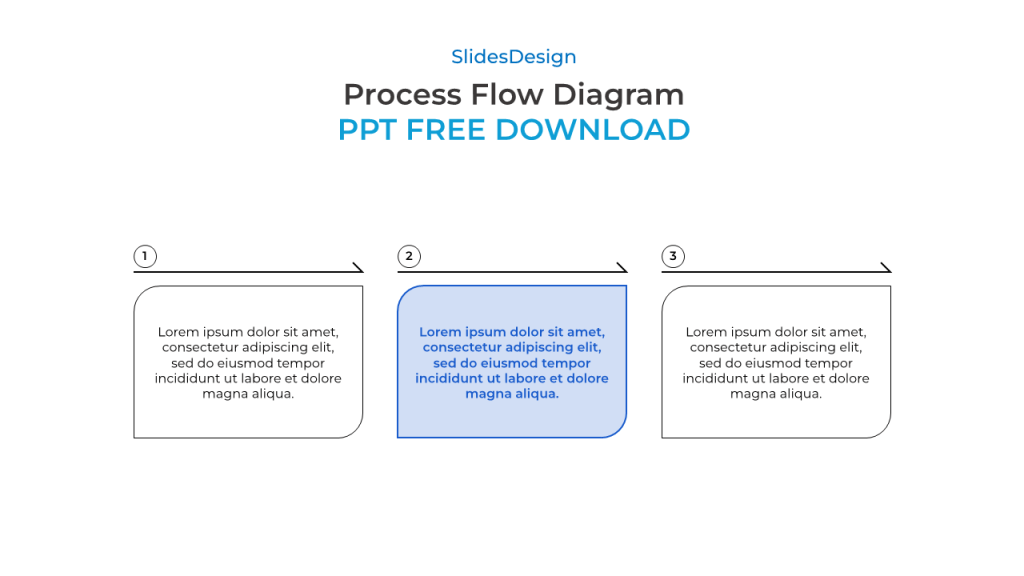
3-Step Process Flow PPT Template
Present your workflow with this simple and elegant 3-step process flow template. Fully customizable in PowerPoint and Google Slides, perfect for clean business communication.
Curved Process Flow PPT Diagram
Show your process with a twist – this free curved process flow diagram adds rhythm and clarity to your presentation. Fully editable in PowerPoint and Google Slides.
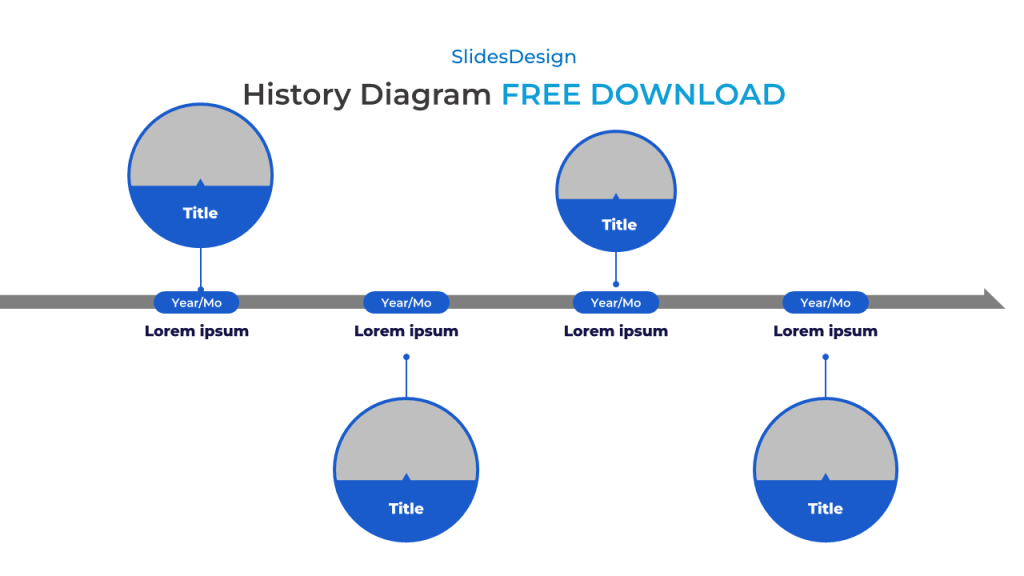
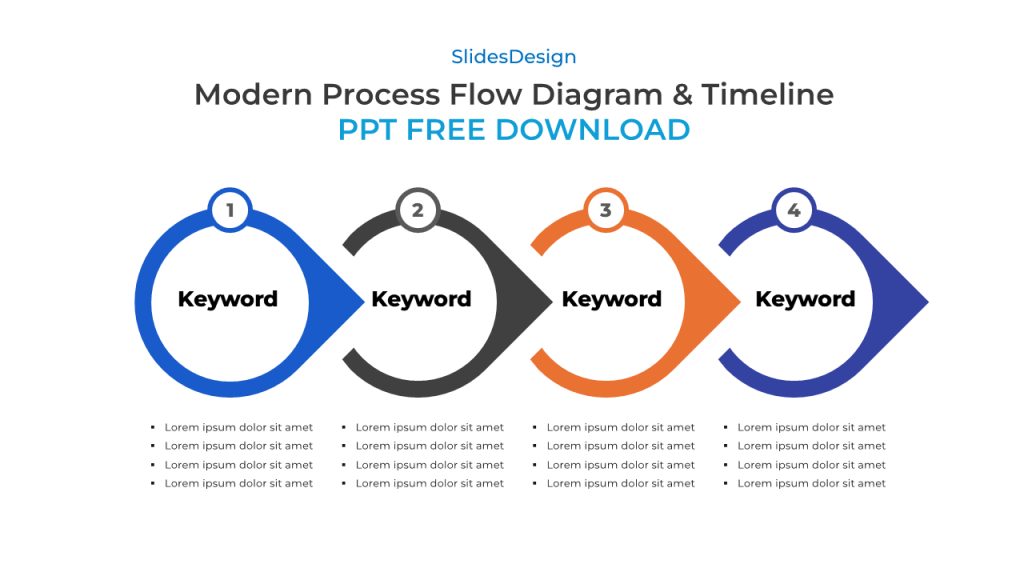
Process Flow Diagram & Timeline Template
Download this process flow diagram and timeline template for PowerPoint and Google Slides. 5-step editable layout with flat illustration design – perfect for project timelines and business workflows.
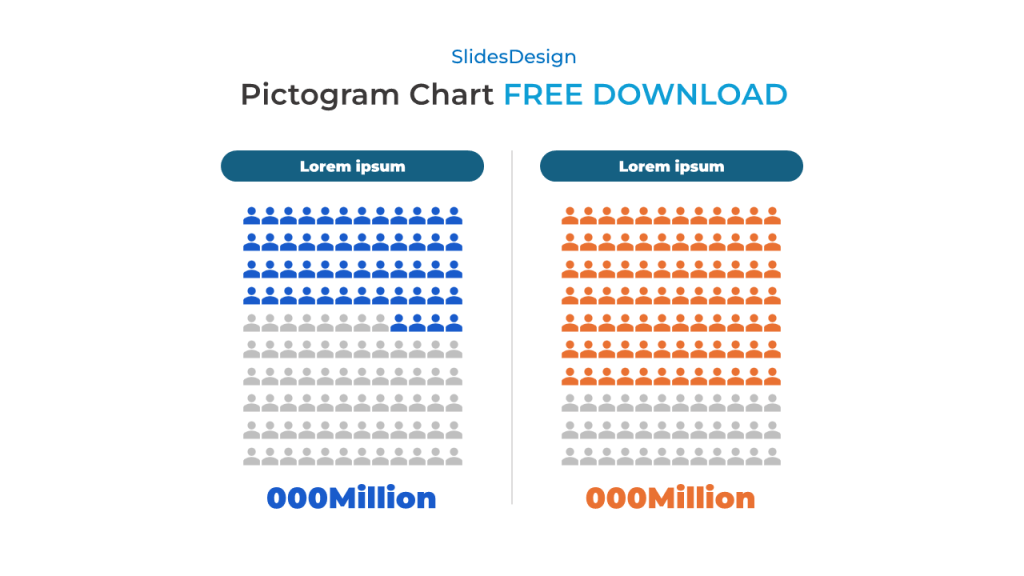
Comparison Diagram PPT Template
Visualize data comparisons easily with this clean and free comparison diagram template. Compatible with Google Slides and PowerPoint, perfect for before/after, A/B testing, and business metrics.
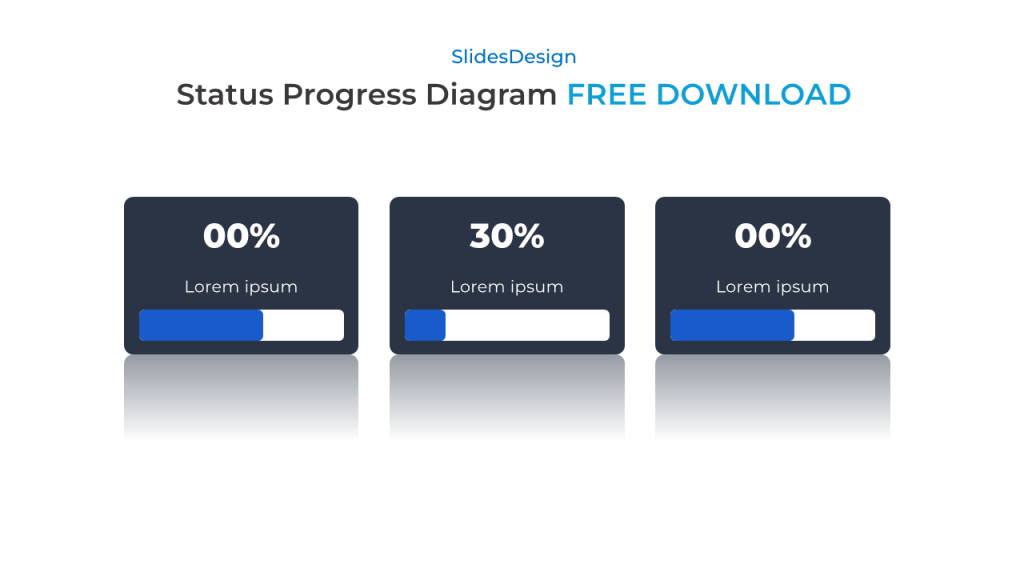
Progress Bar Infographic Template
Track progress with style using this modern progress bar infographic template – fully editable in PowerPoint and Google Slides. Perfect for reporting KPIs, milestones, and project status.
Pictogram Chart Template Free Download
Enhance your presentation with this free pictogram chart template. Designed for PowerPoint and Google Slides, this slide visualizes data using people icons – perfect for comparisons, statistics, and infographics.
About PPT Charts & Diagrams
Turn complex data into engaging, easy-to-understand visuals with our curated collection of 300+ PowerPoint Charts & Diagrams. Whether you’re creating a pitch deck, business report, or lesson plan, find flowcharts, mind maps, timelines, and data-driven graphics to elevate your presentation.
🎁Need a matching PowerPoint template with PPT diagram?
Check out our +30 Free ppt templates to level up your slides.
Go Now →