+300 Free PPT Charts & Diagrams
for Clear, Impactful Presentations
Download high-quality PowerPoint charts and diagram templates
— including flowcharts, Gantt charts, timelines, and infographics — for business, education, and marketing.
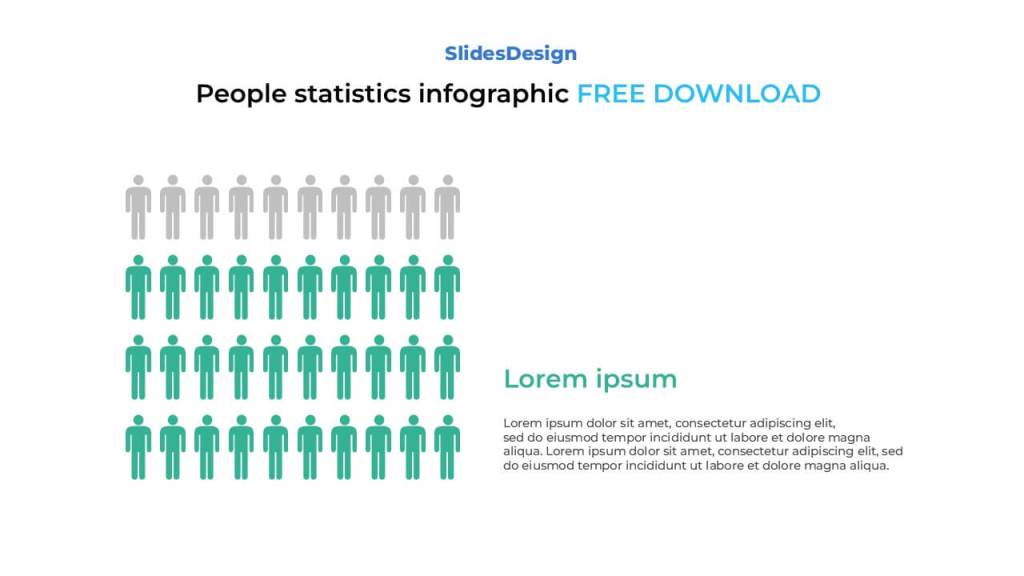
Visualize percentages and proportions using this People Statistics Infographic. Perfect for survey data, team demographics, or research results.
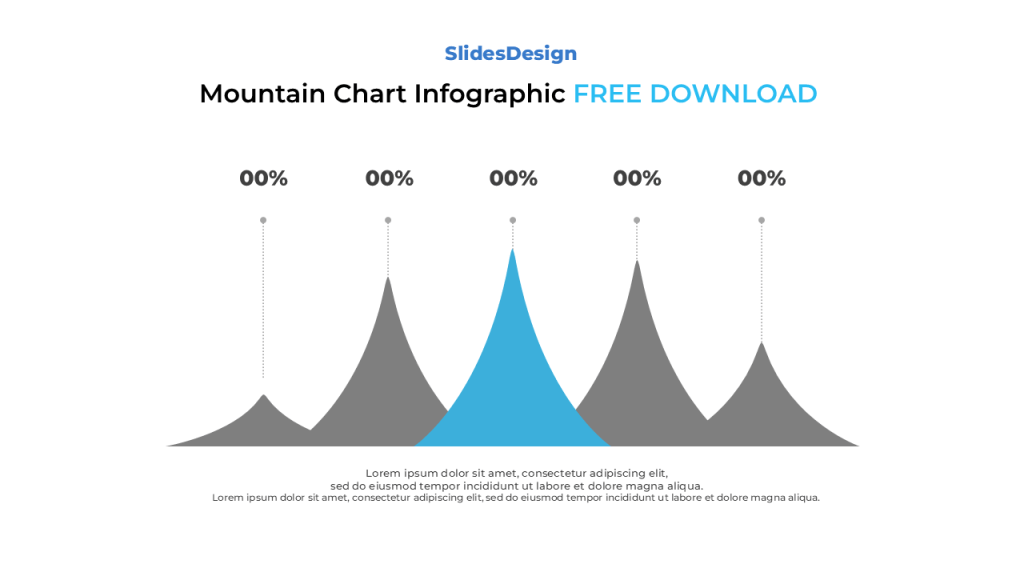
Mountain Chart Infographic
Show your performance peaks with this Mountain Chart Infographic. A clean, data-driven design perfect for tracking growth, trends, and comparisons in business or marketing presentations.
Loop Process Diagram
Visualize continuous workflows and feedback systems with this Loop Process Diagram. Each connected stage represents progress, making it ideal for showing cycles, iterations, and improvement processes.
Multi Layer Circular Chart
Present your data beautifully with this Multi Layer Circular Chart. Each ring represents a level or category, perfect for showing layered data, analytics, or hierarchical information.
Tree Infographic Diagram
Show your ideas branching out beautifully with this Tree Infographic Diagram. A symbolic growth chart ideal for visualizing relationships, structures, or processes in a creative and organized way.
Cycle Arrow Chart Infographic
Show your process in motion with this Cycle Arrow Chart Infographic. A clean circular arrow layout ideal for illustrating continuous workflows, feedback loops, or marketing cycles.
Step Arrow Diagram | 3 Options
Present your ideas with clarity using this Step Arrow Diagram. Perfect for showcasing multi-step processes, training sequences, or workflow strategies in a clear and modern layout.
Horizontal Arrow Process Timeline | 4 Options
Show your project milestones clearly with this Horizontal Arrow Process Timeline. Each connected arrow illustrates your progress step-by-step, perfect for timelines, workflows, or business plans.
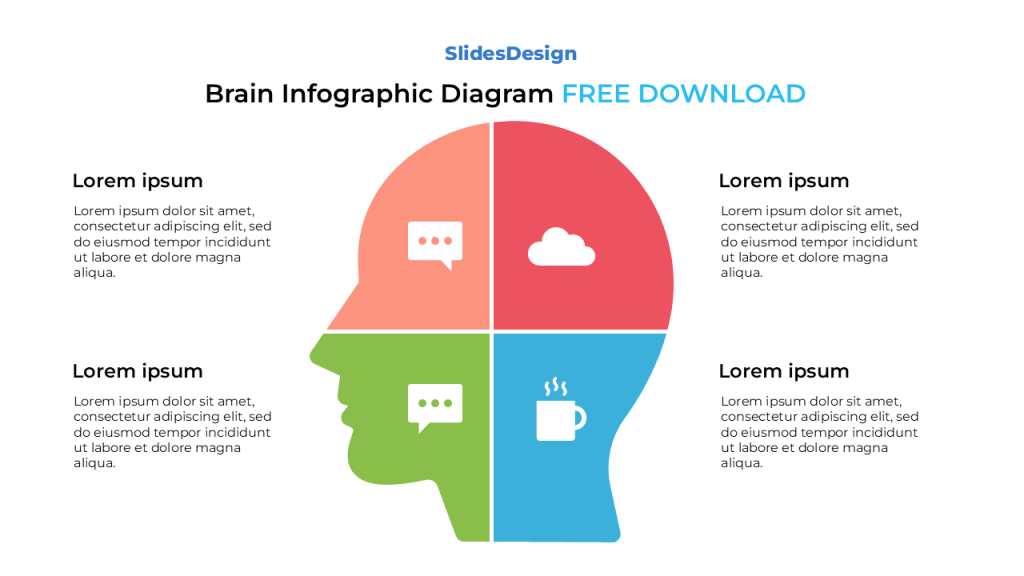
Brain Infographic Diagram | 4 Options
Simplify complex ideas with this clean Brain Infographic Diagram. Great for showing balanced thinking, strategy, and analysis across different topics.
About PPT Charts & Diagrams
Turn complex data into engaging, easy-to-understand visuals with our curated collection of 300+ PowerPoint Charts & Diagrams. Whether you’re creating a pitch deck, business report, or lesson plan, find flowcharts, mind maps, timelines, and data-driven graphics to elevate your presentation.