+300 Free PPT Charts & Diagrams
for Clear, Impactful Presentations
Download high-quality PowerPoint charts and diagram templates
— including flowcharts, Gantt charts, timelines, and infographics — for business, education, and marketing.
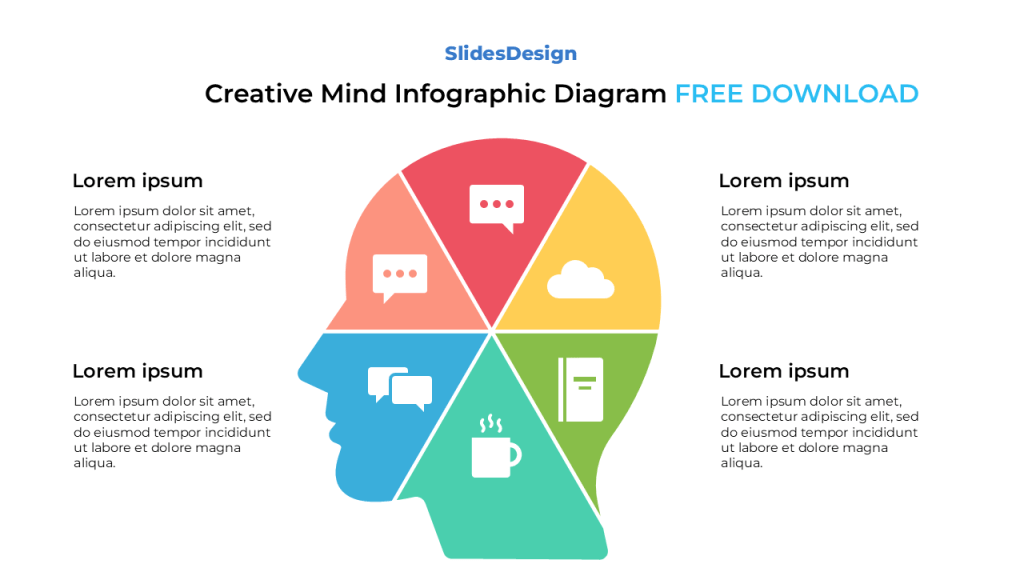
Download the Creative Mind Infographic Diagram for PowerPoint and Google Slides. A colorful, head-shaped infographic perfect for presenting creativity, teamwork, and innovative thinking in a clear and modern layout. 100% editable and free to use.
Chain Process Diagram
A vibrant and professional PPT template illustrating step-by-step chain-linked processes or operations
Gear Process Flow Diagram
A creative PowerPoint template with gear graphics for visualizing cycles and interconnected processes.
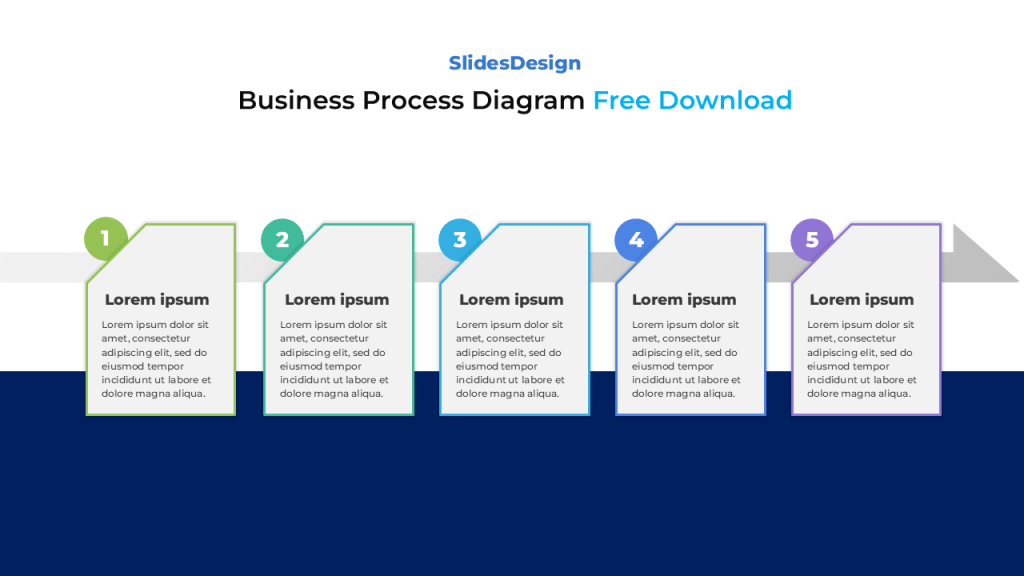
Business Process Flow Diagram
A free, editable PowerPoint template for illustrating step-by-step business processes or strategic workflows.
SWOT Analysis Diagram
Create a professional SWOT analysis presentation with this free template for PowerPoint and Google Slides. Its colorful and simple design makes complex ideas easy to understand.
Hub and Spoke Diagram
A modern hub and spoke diagram template for PowerPoint and Google Slides, ideal for business strategies, process visualization, and professional presentations.
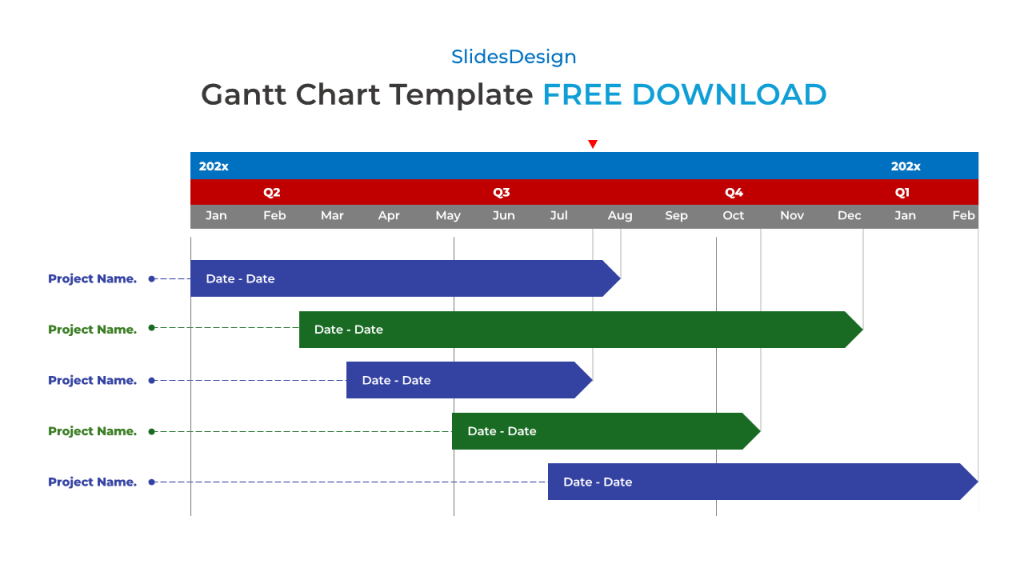
Project Timeline Gantt Chart Template
Track your project schedule with this free Gantt chart timeline template. Editable in PowerPoint and Google Slides, ideal for managing project tasks, deadlines, and progress by quarter.
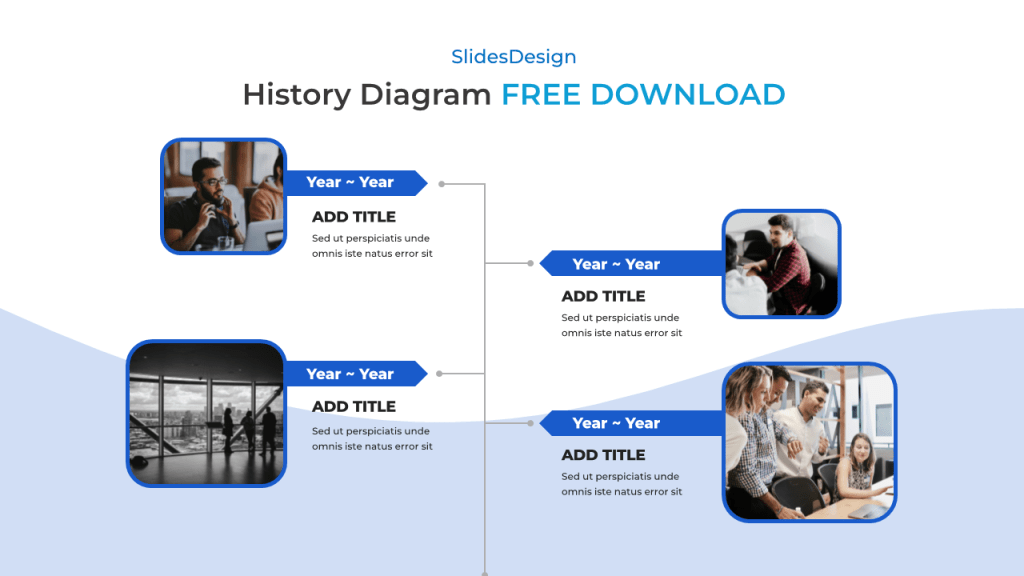
History Timeline Diagram
Tell your story step by step with this split history timeline template. Free to download and fully editable in PowerPoint and Google Slides – great for company history, education, or growth tracking.
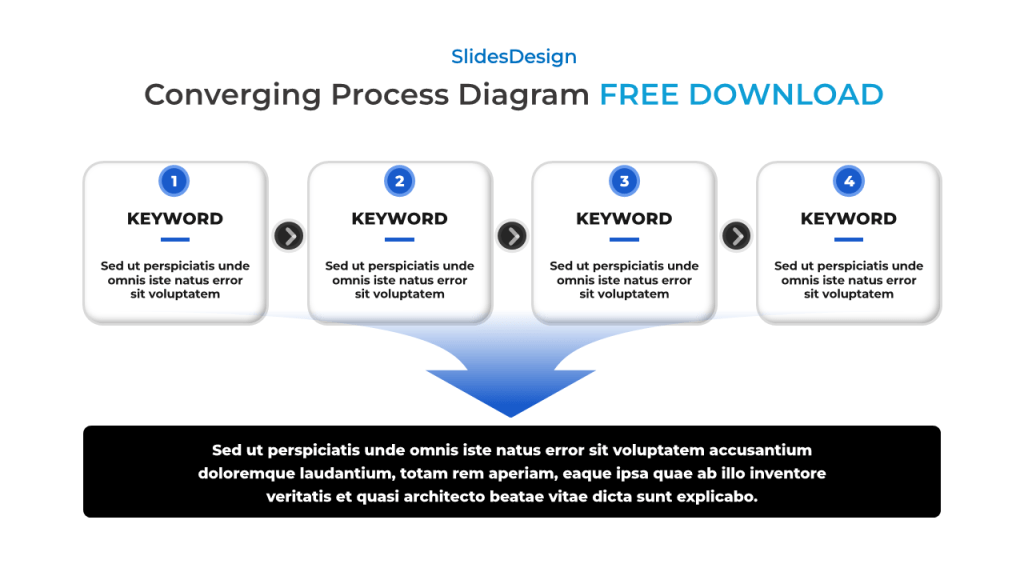
Step-to-Outcome Converging Flow Diagram
Present a process that leads to one clear result using this converging flow diagram. 4 sequential steps + 1 final outcome block – perfect for business strategies, decision-making flows, and project reporting.
About PPT Charts & Diagrams
Turn complex data into engaging, easy-to-understand visuals with our curated collection of 300+ PowerPoint Charts & Diagrams. Whether you’re creating a pitch deck, business report, or lesson plan, find flowcharts, mind maps, timelines, and data-driven graphics to elevate your presentation.