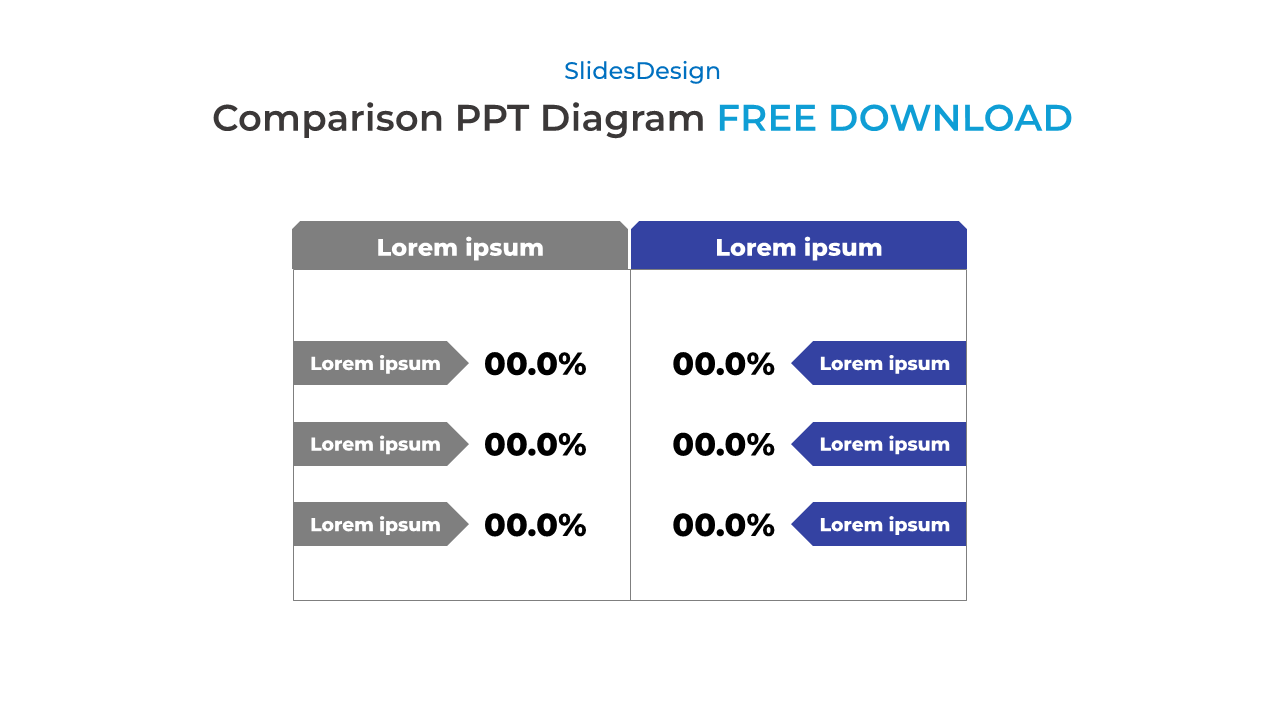
Free Comparison Diagram PPT Template – Google Slides & PowerPoint This comparison diagram template offers a professional and easy-to-read format to help you visualize two sets of data side by side. Whether you’re comparing product features, campaign performance, or tracking before-and-after results, this layout delivers clarity with structure.
Designed for both PowerPoint and Google Slides, this infographic-style table includes editable labels, percentage indicators, and directional blocks to guide viewers’ focus. Use it in business presentations, pitch decks, or team meetings where data-driven decision-making matters.
Available as a free download, ready to edit and use instantly.
1️⃣ Side-by-Side Comparison Layout
Clearly separate two sets of information for instant visual comparison.
2️⃣ Editable Text & Percentages
Customize all values and labels to match your specific content.
3️⃣ Modern Design with Directional Indicators
Clean layout with arrow shapes that guide the viewer’s eye intuitively.
4️⃣ Free & Fully Compatible
Works seamlessly in PowerPoint, Google Slides, and any ppt templates.